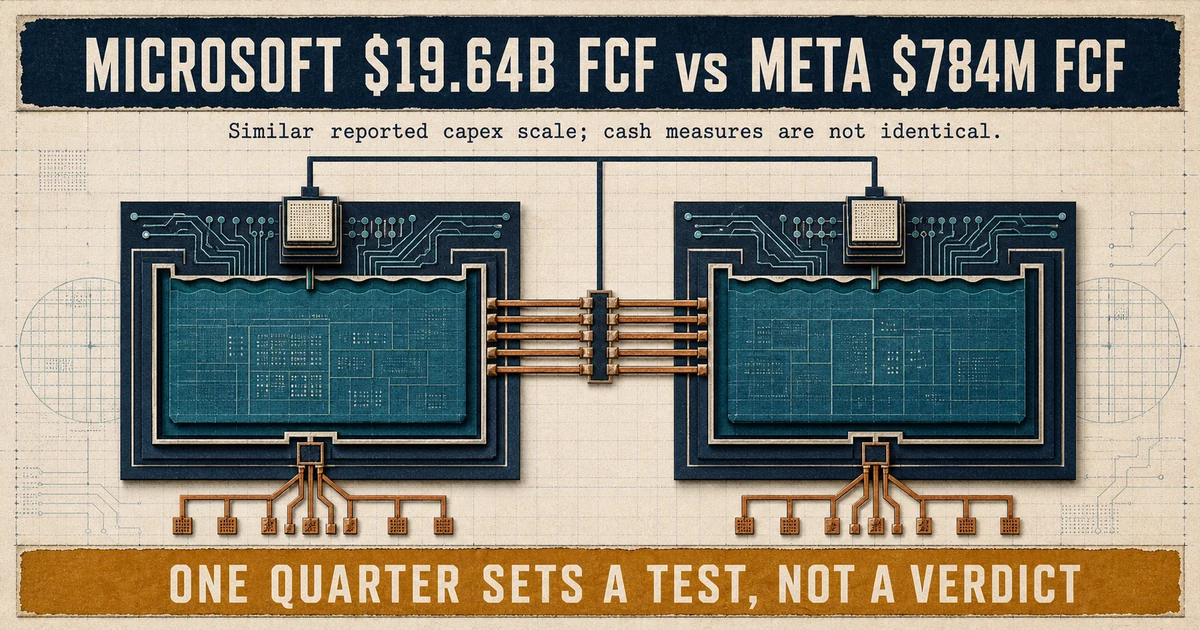
For two months the argument about AI capital spending has been conducted in the abstract. Is it too much? Does it stop? On July 29 the two companies best placed to answer filed their numbers within hours of each other, and the answers pointed in opposite directions – not on how much they spend, but on what is left when they are done.
Comparable ambition, sharply different cash residue
Start with what the two companies did at similar scale. Microsoft put $35.8 billion into capital spending in its June quarter and $115.9 billion into property and equipment across the fiscal year. Meta spent $31.08 billion in its June quarter, including principal payments on finance leases, and told investors to expect 2026 capital expenditures of $130-145 billion, narrowed from its previous $125-145 billion range. On an annual basis, Meta now intends to outspend what Microsoft just spent.
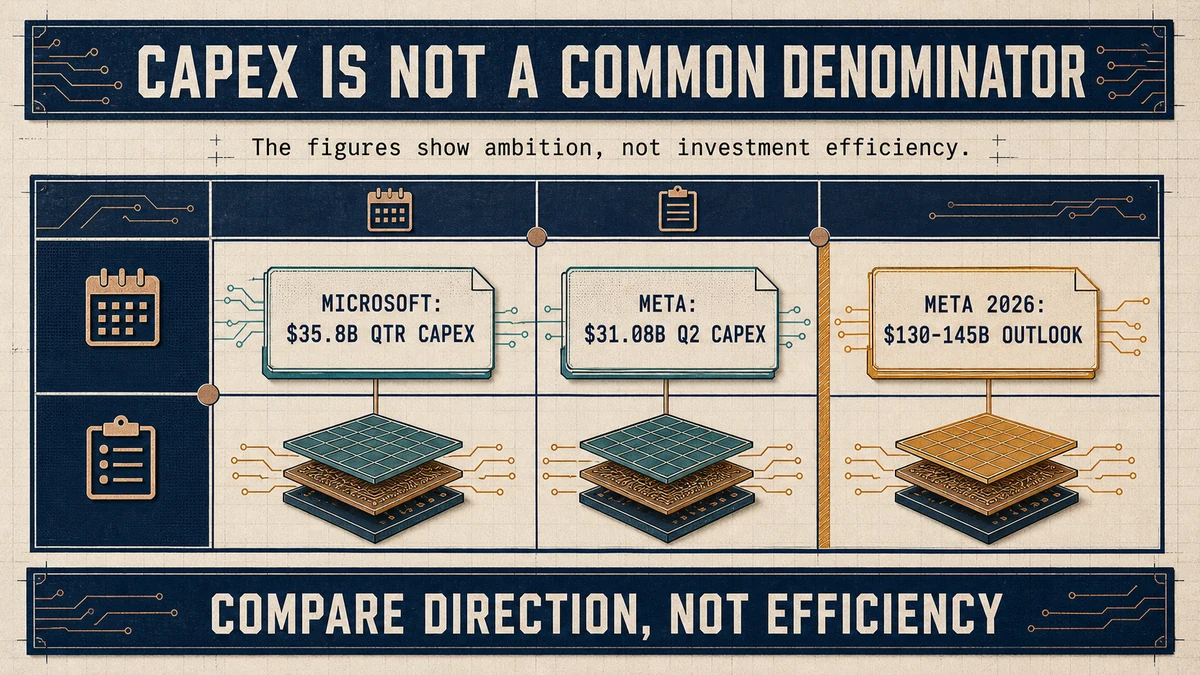
Those are not normalized figures. Microsoft’s annual number covers a completed fiscal year. Meta’s is a calendar-year forecast that includes finance-lease principal. The figures establish comparable ambition, not a common denominator, and they should not be turned into a precise ranking of investment efficiency.
Both businesses also grew. Microsoft reported revenue of $90.0 billion, up 18%, while Azure and other cloud services revenue increased 43%. Meta reported revenue of $60.80 billion, up 28%, giving it the faster top-line growth rate.
The cash residue nevertheless moved in sharply different directions. Meta reported June-quarter free cash flow of $784 million, down from $8.549 billion a year earlier. Microsoft’s June-quarter free cash flow was reported at $19.64 billion, down from $25.57 billion. Microsoft’s own release states full-year cash flows, so its quarterly free-cash-flow line remains attributed to the supplied trade-press report.
These are two observations, not one standardized ratio. Meta grew revenue faster, but its free cash flow fell to about nine percent of the year-ago result. Microsoft absorbed a reported 69% increase in quarterly capital spending and still finished with free cash flow in the tens of billions. Neither result measures the other company’s efficiency, and neither isolates the return on a particular AI asset.
What the cash-conversion test can and cannot show
The distinction is not “good company, bad company,” and it is not a claim about which company is building the better AI business. It measures something narrower: how much companywide cash remains after reported capital outlays over the stated period. It does not trace a particular capex dollar to cash generated by the asset it funded.
Microsoft’s spending enters a business that can bill for cloud capacity as customers consume it. Azure revenue rose 43%, and deployed capacity already has a metered path to revenue. The release does not establish whether assets funded during the June quarter generated revenue in that same quarter, so Azure’s growth cannot be treated as a direct return calculation for the latest capex.
Meta’s spending enters a business that principally monetizes attention. Revenue rose 28%, but income from operations fell to $18.775 billion from $20.441 billion, while net income fell to $15.848 billion from $18.337 billion. Costs and expenses increased 55%, faster than revenue. Those are reported companywide movements. They show pressure on cash conversion, but they do not establish that AI infrastructure alone caused the pressure.
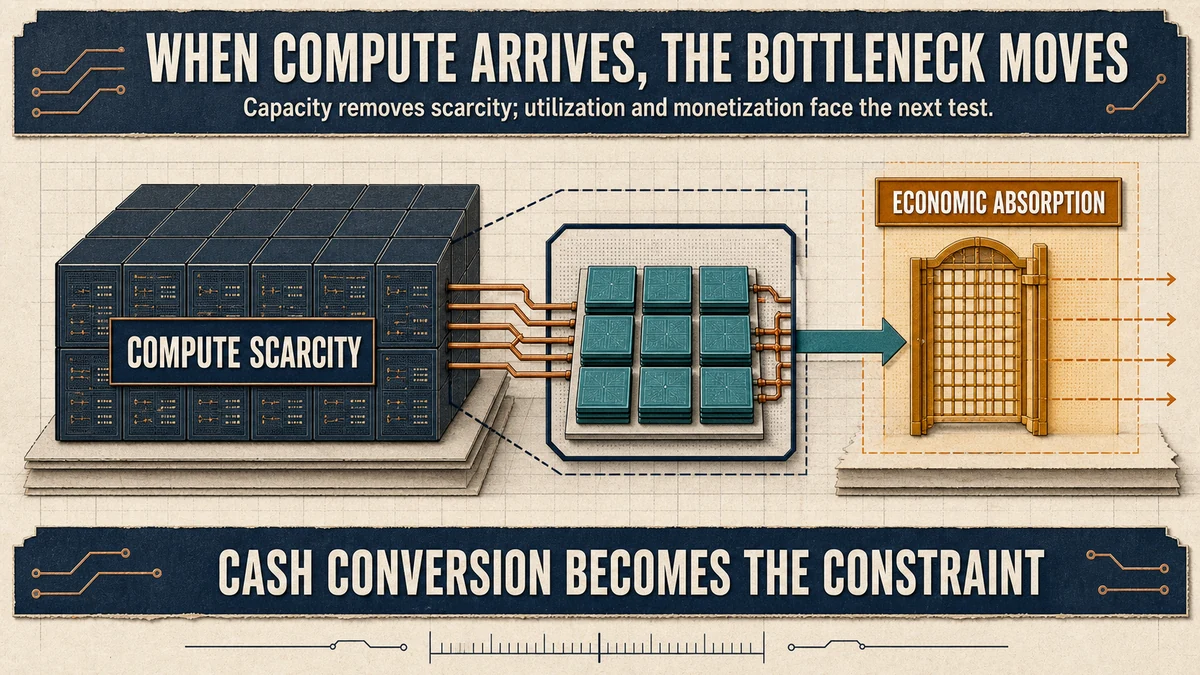
The current physical bottleneck is access to enough compute and data-center capacity. Heavy spending is intended to remove that constraint. As servers, memory, storage, networking, and supporting infrastructure arrive, however, the bottleneck moves. The next constraint is whether utilization and monetization can absorb depreciation, leases, power, staffing, materials, and continued expansion quickly enough to preserve cash.
That is the central change in the debate. Both companies are converting capital into compute. The disclosures show that one retained quarterly free cash flow in the tens of billions while the other retained less than $1 billion under its own reported measure. They do not show whether the assets purchased in the quarter produced the revenue recognized in the quarter.
Why one quarter cannot settle the argument
Free cash flow is lumpy, and one quarter is a weak foundation for a permanent conclusion. Property purchases, construction payments, equipment deliveries, and lease principal arrive in uneven blocks. A large payment in June can depress the June quarter and make the next period look better without changing the strategy or the lifetime economics of the asset.
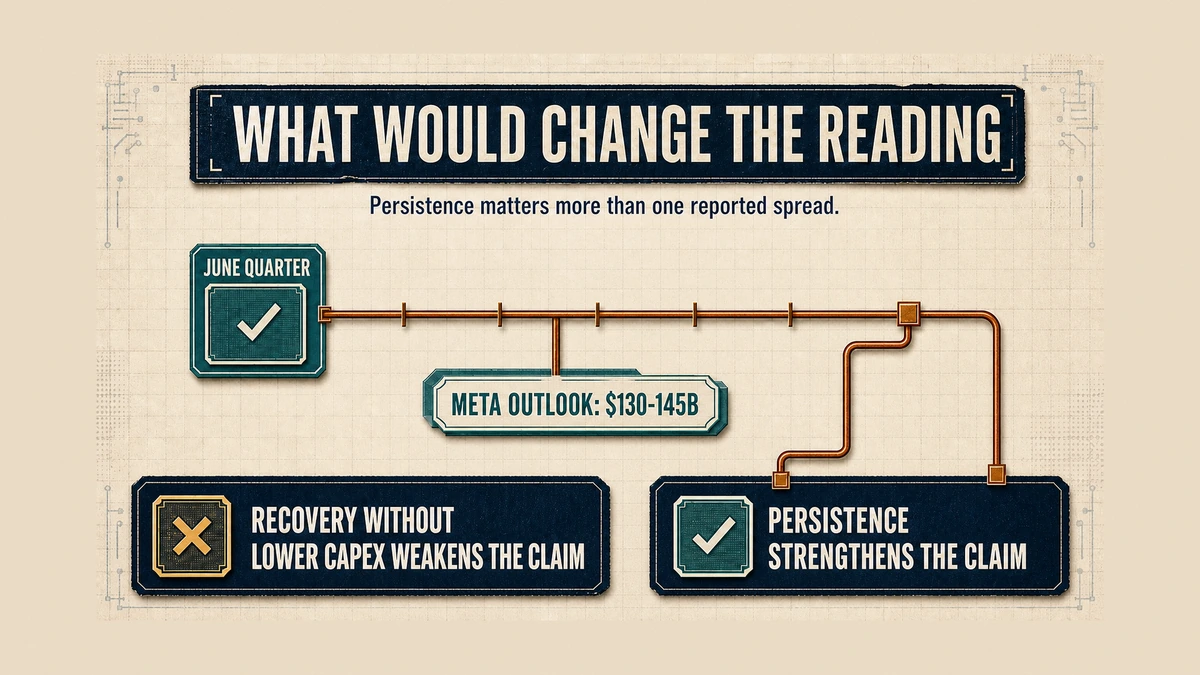
Meta’s free cash flow could therefore recover next quarter while spending remains high. Nothing in its release signals a retreat. Management raised the bottom of its 2026 capex range from $125 billion to $130 billion while leaving the $145 billion ceiling intact. That is a company claim about intended spending, not proof of the future return on that spending.
There is also a definitional gap worth keeping visible. Meta’s disclosed capital-spending figure includes principal payments on finance leases. Microsoft’s published quarterly capital-spending line does not use the same construction. The two numbers are close enough in scale to compare ambition and direction, but they are not identical instruments.
The honest form of the thesis is therefore conditional. If Meta’s free cash flow recovers while its capital program remains elevated, timing will have explained much of the June gap. If the gap persists over several reporting periods, cash conversion will become a durable bottleneck that markets can price and suppliers can monitor.
This qualification does not empty the comparison of meaning. It defines the point at which the claim could be disproved. A timing artifact should reverse. A structural conversion gap should remain visible when the figures are measured consistently across multiple quarters.
Where equipment and material risk moves next
For memory and storage suppliers, the distinction is not academic. They do not sell to an abstraction called “AI.” They sell equipment and materials into specific customer budgets, and those budgets carry different risks depending on whether spending is replenished rapidly from operations or has to be carried through a cash trough.
Capital spending that converts quickly can be funded internally and may be less sensitive to credit conditions. Spending that converts slowly consumes more internally generated cash and can increase exposure to financing costs, balance-sheet capacity, project timing, and shareholder patience. The same order book looks different depending on which type of budget supports it.
The immediate problem being removed is insufficient infrastructure capacity. The new problem is economic absorption: whether additional capacity is utilized at a level that supports its full cost. That shift affects who owns value and who owns risk. Cloud or platform customers own the utilization and monetization decision. Equipment and material suppliers capture value when orders become shipments, but they retain customer-concentration and timing risk. Investors bear the effect if continuing capital needs reduce cash residue for longer than expected.
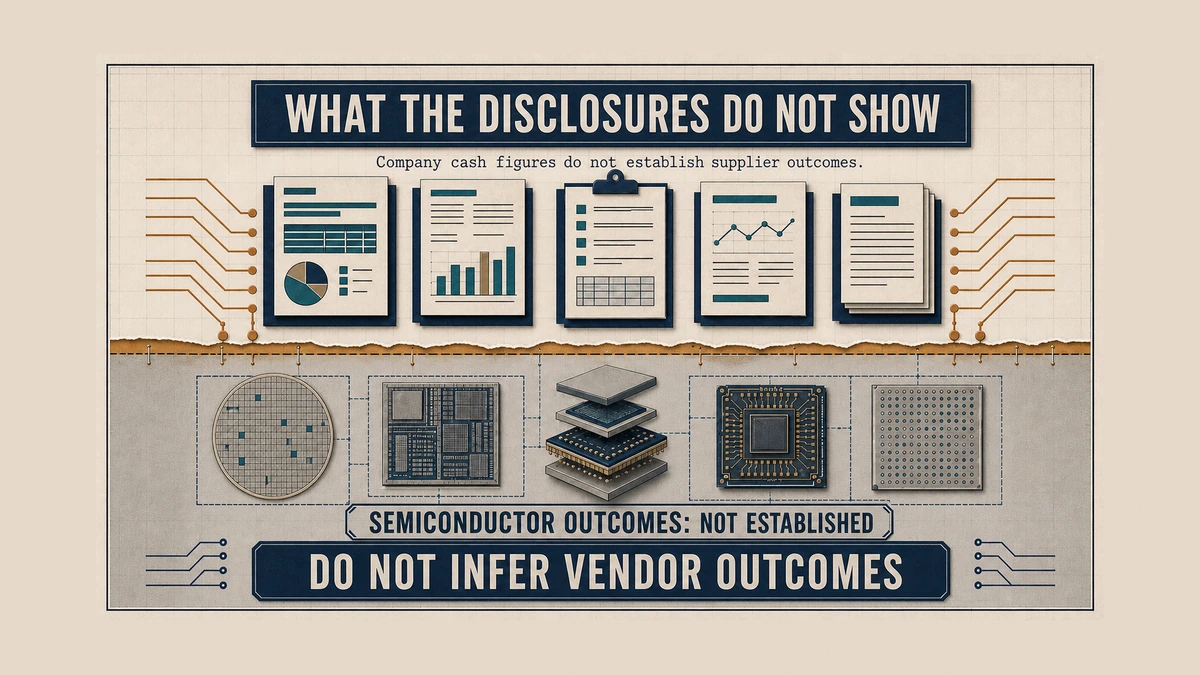
The supplied disclosures do not report semiconductor manufacturing yield, individual equipment utilization, component-level material consumption, or vendor qualification results. No conclusion about those measures should be invented. The supported inference is narrower: if installed capacity does not convert into revenue and cash quickly enough, future equipment additions, material orders, and the pace of supplier qualification can face closer economic scrutiny.
Qualification can make a component difficult to replace once it is embedded in a platform, but it cannot eliminate the customer’s funding risk. A qualified supplier concentrated in one customer’s expansion plan may still be more exposed than a supplier serving both companies or a broader set of budgets. Conversely, a customer that can sustain spending from operating cash may preserve optionality across equipment generations and supplier choices.
This distinction matters as much as the phantom gigawatts inside announced data-center demand, and for the same reason: an announced number is not yet a paid one. Meta has not said it will cut. Its outlook says the opposite. The risk being identified is the durability and timing of cash conversion, not an asserted cancellation.
The observations that would confirm or break the thesis
- Meta’s next free-cash-flow result against the capex outlook it has already narrowed upward. A recovery without a capex reduction would weaken the claim that the June result exposed a durable conversion problem.
- Whether Azure growth remains strong while Microsoft’s free cash flow, measured consistently against its disclosed capital outlays, stays materially above Meta’s.
- Any change to Meta’s $130-145 billion outlook. That range is management’s clearest disclosed statement about its willingness to keep spending through the cash trough.
- Whether the free-cash-flow gap survives several quarters after differences in capital-spending definitions are kept explicit. Persistence matters more than a single reported spread.
Our read is that the AI capex argument has quietly changed shape. It began as a question about magnitude: whether the total was too large to be rational. The July 29 filings turned it into a question about conversion, which is narrower and easier to test. Magnitude arguments often depend on distant assumptions. Operating cash flow and capital outlays are reported regularly, although their definitions differ and a valid comparison must keep those differences visible.
Microsoft and Meta reported on the same day with comparable capital ambition. For the same June quarter, their reported free-cash-flow figures were $19.64 billion and $784 million respectively. The useful question about AI spending is no longer only how big it is. It is how much companywide cash remains after the spending, whether that residue can finance the next expansion, and where the bottleneck moves after raw compute capacity begins to arrive.
One quarter cannot decide which model wins. It can establish the test. If the gap closes, timing wins the argument. If it persists, cash conversion becomes the constraint, and the value of the build-out will depend increasingly on which companies, suppliers, and investors can carry that constraint without breaking the spending cycle.
This article is for informational and educational purposes only and does not constitute investment, financial, or legal advice.
Sources
- microsoft.com — Microsoft FY26 Q4: revenue $90.0B +18%; Microsoft Cloud $59.3B +27%; Azure and other cloud services +43%; Q4 capital spending $35.8B; FY additions to property and equipment $115,948M; FY operating cash flow $182.9B. No forward capex guidance in the release. (2026-07-29)
- sedaily.com — Reporting Microsoft’s June-quarter free cash flow at $19.64B versus $25.57B a year earlier (-23%) on a 69% rise in quarterly capital spending. The company’s own release states full-year cash flows only; the quarterly free-cash-flow line is taken from this trade-press account. (2026-07-30)
- investor.atmeta.com — Meta Q2 2026: revenue $60.80B +28%; income from operations $18,775M vs $20,441M; net income $15,848M vs $18,337M; capex incl. finance-lease principal $31.08B; free cash flow $784M vs $8,549M; 2026 capex outlook $130-145B, narrowed from $125-145B. (2026-07-29)