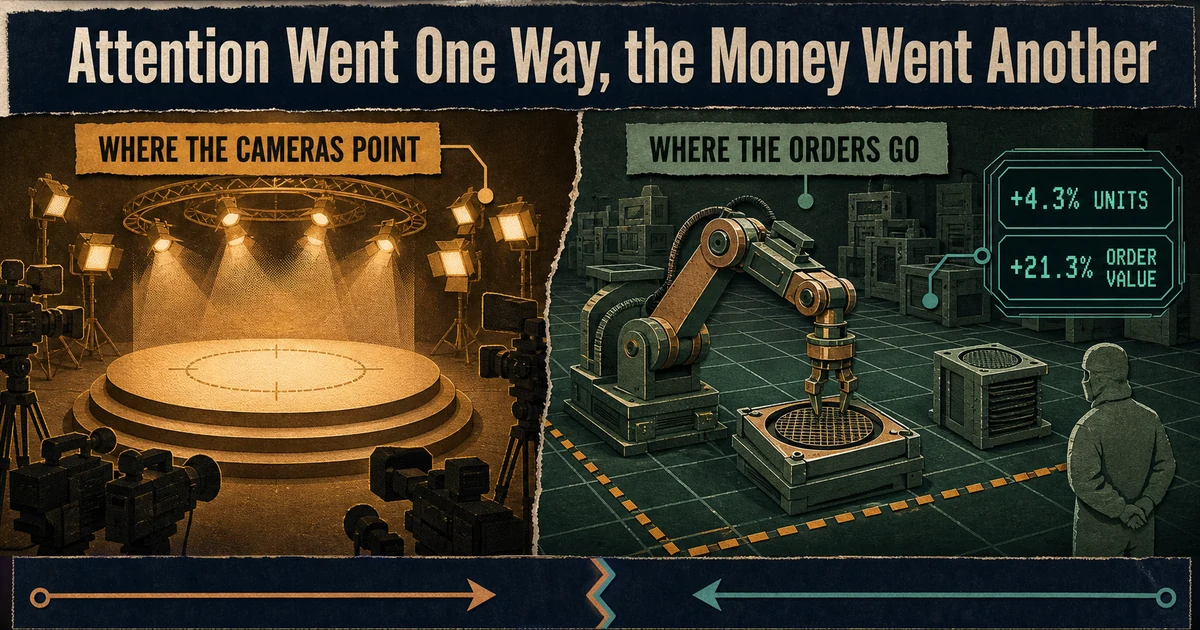
North American manufacturers ordered 4.3 percent more robots in the second quarter of 2026 than they did a year earlier. They spent 21.3 percent more money doing it. Five points of order-value growth for every point of unit growth is not a rounding artifact, and it is the clearest available signal of where real, paid-for robot capital moved this quarter – a quarter that also carried a Hyundai factory strike framed around humanoid robots and a new US ban on imported Chinese ones.
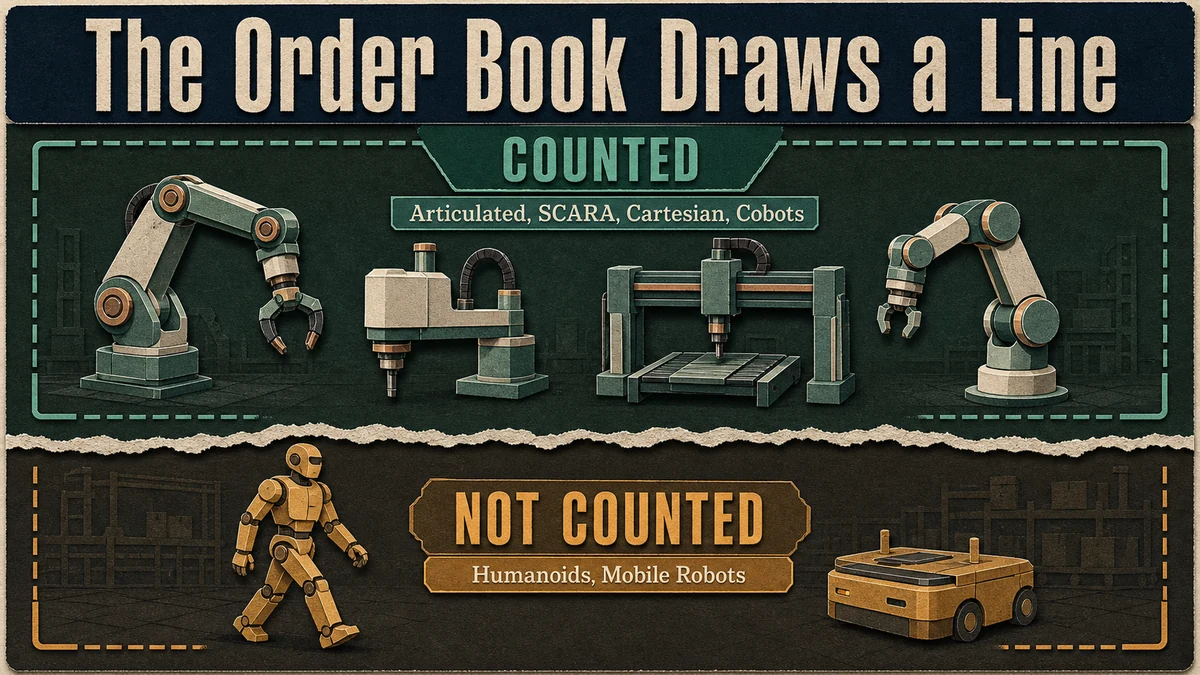
None of that policy noise touches the number above. The Association for Advancing Automation, the trade body that has tracked North American robot orders for three decades, does not count humanoids in its order book at all. So while press attention spent the summer on Atlas and Unitree, the purchase orders A3 does count – the robots companies are paying for right now, not piloting or announcing – were going somewhere else entirely.
Same Order Book, Different Shopping List
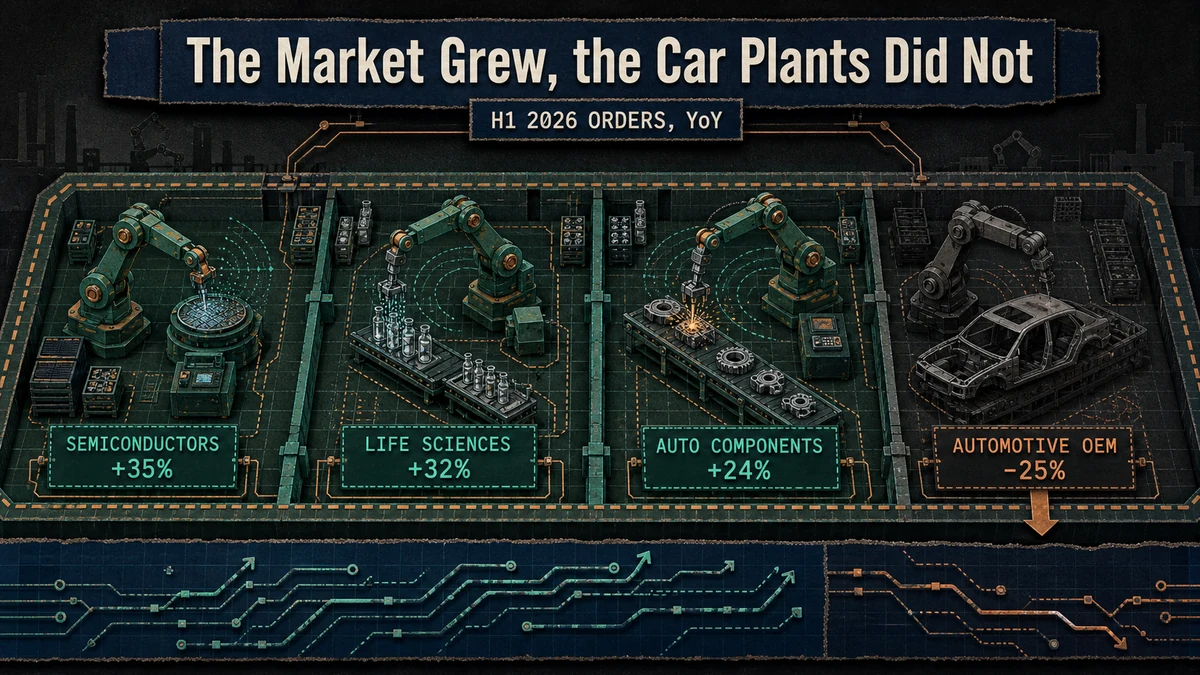
A3's first-half 2026 total was 17,995 robots ordered, worth $1.166 billion, up 2.0 percent in units and 6.6 percent in value from the same period in 2025. Broken out by industry, the growth is lopsided – and the segment falling is the one everyone assumes is booming.
| Sector | H1 2026 order growth, YoY |
|---|---|
| Semiconductors / electronics / photonics | +35% (+38% in Q2 alone) |
| Life sciences / pharma / biomedical | +32% |
| Automotive components | +24% |
| Food & consumer goods | +17% |
| Plastics & rubber | +6% |
| Metals & metalworking | +3% |
| Automotive OEM | -25% |
Automotive OEM – the historic center of the robotics industry, the segment that put "robot" and "assembly line" in the same sentence for fifty years – is the only line in that table shrinking. Non-automotive orders now make up 56 percent of everything A3 counted in the second quarter, a threshold this market has not crossed before. Collaborative robots cluster heavily in exactly the two fastest-growing sectors: healthcare and electronics together take four out of every five cobot orders placed.
Read plainly, robot buying grew far faster at a chip fab or a pharmaceutical packaging line this spring than at a car plant. It does not say a fab bought more arms than a car plant did – these are growth rates against last year, and A3 publishes no sector volumes to settle that. Read against the headlines, even the growth rates are close to the opposite of the story everyone was telling.
What Seven Percent Growth Was Supposed to Look Like
Going into 2026, the industry's own forecasters expected a real recovery. Interact Analysis projected global industrial robot shipments returning to growth above 7 percent this year, following a 5.1 percent rebound in 2025 and a 2 percent contraction in 2024. That is a volume story – more robots, broadly, across a market coming off two rough years.
What actually arrived in North America looks nothing like that shape. Unit growth for the first half came in at 2.0 percent, well under the forecast pace, even as order value rose more than three times faster. The scopes are not identical – Interact Analysis's figure is global shipments, A3's is North American orders – so this is not a clean beat-or-miss against a single number.
But the two data sets tell a consistent story on direction: the recovery forecasters expected to show up broadly, in volume, instead showed up narrowly, in dollars, concentrated in a handful of sectors that were not the ones carrying the market before.
The Robots Not in This Order Book
It is worth stating plainly what "does not count humanoids" means here, because it is doing real work in this article. A3's tracked categories are traditional articulated, SCARA and Cartesian arms as defined by ISO and IFR, plus the collaborative-robot class it started tracking separately in 2025. A humanoid platform is a different statistical animal, and none of this quarter's growth or contraction numbers include one.
That gap matters this particular week. A Hyundai Korea labor dispute in July drew national coverage – Forbes ran the headline "We Just Had The First Humanoid Robot Strike Ever" – over union demands that no robot enter a plant without a labor agreement, and warnings about an "employment shock" from the 25,000-plus Atlas units Hyundai plans across its US and Korean plants.
This desk covered that same strike in early August, and corrected its own framing after publication: the dispute centered on pay and retirement age, and Atlas deployment "is not part of the current labor-management discussions," with no deployment date set for Korean plants and Georgia not scheduled to start until 2028.
The same week, Washington moved to bar new imports of Chinese-made humanoid and quadruped robots on national-security grounds – a real policy action this desk covered in detail when it happened, and one that reshapes where humanoid supply can legally come from, without adding a single unit to anyone's order book.
The honest counter to all of this: humanoid robots are pre-revenue by design right now, not failing to compete. Figure has said plainly that the units it ships go to its own research and data-collection groups, not to paying customers – a deliberate ramp, not a stalled one. A3's order series was built for an industrial-robot market that existed before humanoids did, so their absence from it is a category-definition fact, not a verdict on whether they eventually scale.
What this quarter's data shows is narrower and more checkable than that: where the money already moved, not where it will move next.
Where the Extra Dollars Are Probably Going
A3 publishes unit counts and dollar totals for each period, plus year-over-year growth rates for both. It does not publish the number those figures imply: the average price paid per robot, period by period. Dividing dollars by units, using A3's own two headline percentages to back out each period's prior-year comparator, turns up something A3 never states outright – the swing shown above was not a steady climb.
Implied average order value per robot fell roughly 6.2 percent year-over-year in the first quarter of 2026 – about $64,100 down to $60,100 – then rose roughly 16.3 percent in the second, from about $59,800 to $69,600. Every 2025 figure there is back-solved from A3's own published growth rates rather than published by A3, so the direction and rough magnitude are what carry weight, not the last digit. Something specific changed in the April-to-June window, not across the whole first half evenly.
The tempting explanation is the sector mix: semiconductor and life-sciences robots, built for cleanroom precision and often paired with vision systems, cost more than the automotive-OEM arms they are partly displacing. That is plausible, and it is not proven. A3 does not publish average order value by sector, and the sectors driving this quarter's growth are also the sectors buying the most collaborative robots – the cheapest category in the data, priced roughly 37 percent below the period's blended average. Healthcare and electronics together account for 80 percent of all cobot orders.
That pull should drag those sectors' average price down, not up. The market-wide average rose anyway, which is consistent with those buyers placing non-cobot systems expensive enough to outweigh their own appetite for cheap collaborative arms. It does not establish it. Cobots were 15.4 percent of first-half units but only 12.7 percent of second-quarter ones – a thinner slice of the cheapest category lifts a blended average by itself, without a single robot costing a dollar more. A3's public data cannot separate the two explanations.
The technology behind that precision demand is real but still maturing. A May 2026 paper on automated optical inspection of wire-bonded semiconductors – the kind of AI vision layer a chip-sector robot cell increasingly runs alongside its arm – describes a persistent friction: segmentation models are "typically device-specific and must be re-trained when new devices or distribution shifts appear," and the paper's own contribution is a method to cut that retraining burden, not eliminate it.
Nobody has published how much of the integration cost behind this quarter's semiconductor orders is arm, and how much is the AI vision stack bolted onto it.
The Same Week, A Different Robot Story
This desk has spent the last two weeks on humanoid robots – Unitree's IPO, Atlas at Hyundai's Metaplant, the FCC's import restrictions. Each of those pieces was really asking the same question from a different angle: what actually gates humanoid deployment. This one is not a sixth answer to that question. It is a different one: while that debate ran, where did the money that has already changed hands go?
It went to precision manufacturing, and Korea sits inside that story more directly than it sits inside the humanoid one. Korean semiconductor fabs are exactly the kind of facility A3's fastest-growing category describes, and Korean cobot makers are already selling into it: Doosan Robotics counts semiconductor customers alongside automotive and electronics accounts and reports more than 10,000 cumulative cobots sold across 40 countries, and Samsung Electronics holds a 20.29 percent stake in Rainbow Robotics, a Korean cobot maker that builds its own motors, controllers and reducers in-house.
Neither company's orders are inside A3's North American count – the connection is structural, not a claim that Korean makers captured any of the dollars measured here – but it says where the next domestic data point worth checking sits: not on a Georgia factory floor with a humanoid on it, but in a fab bay with an ordinary-looking arm.
Bottom Line
The number that made news this quarter was the wrong one to watch for what actually happened. Unit growth of 4.3 percent sounds like a modest, unremarkable robotics market. It is not modest; it is narrow. The dollars moved five times faster than the units did, and they moved in a quarter when semiconductor and life-sciences orders surged while automotive OEM orders fell – the floors that both built this industry and now anchor its most visible anxieties. A3 publishes sector growth, not sector dollars, so that is a direction, not a ledger of where each dollar landed.
None of that spending shows up as a humanoid, because the dataset was never built to count one. This is technical direction, not investment advice, and the claim here is bounded on purpose: one quarter, one region, one trade body's counting rules. It resolves – supports, complicates or reverses – when A3 publishes its Q3 2026 numbers around November, and it would break immediately if that release shows automotive orders recovering while semiconductor and life-sciences growth cools.
Until then, the most concrete thing anyone can say about where robots are actually being bought is: not where the cameras have been pointed.
Sources
- therobotreport.com — The Robot Report, citing A3: Q2/H1 2026 North American robot order totals, sector growth breakdown, collaborative-robot figures, and A3 EVP Alex Shikany's quote on market mix. (2026-08-12)
- roboticstomorrow.com — RoboticsTomorrow, citing A3: independent corroboration of the same Q2/H1 2026 topline and sector figures. (2026-08-11)
- businesswire.com — A3, via Businesswire release archive: methodology confirming the tracked order series covers traditional articulated/SCARA/Cartesian and collaborative robots, not humanoid or mobile robots. (2025-05-12)
- interactanalysis.com — Interact Analysis: global industrial robot shipment forecast of 7%+ growth for 2026, following 5.1% growth in 2025 and a 2024 contraction of -2%. (2026)
View all sources
- arxiv.org — Figueira et al., arXiv preprint: automated optical inspection segmentation models for wire-bonded semiconductors are device-specific and require retraining for new devices or distribution shifts. (2026-05-12)
- eweek.com — eWeek: Hyundai Korea partial strike coverage, union automation-related demands, and Atlas deployment timeline (Georgia 2028, no Korean date announced). (2026-07-16)
- doosanrobotics.com — Doosan Robotics company material and aggregated coverage: semiconductor-sector customer base, cumulative cobot sales, and Samsung Electronics' 20.29% stake in Rainbow Robotics. (2025-2026)
- Hyundai Humanoid Robot Strike Labor Test — This desk's own prior reporting and published correction: the July 2026 Hyundai strike centered on pay and retirement age, with Atlas deployment not part of the labor-management discussions. (2026-08-04)
This article is for informational and educational purposes only and does not constitute investment, financial, or legal advice.